
What you will learn
- Explain why cells with the same genome express different genes, and list the steps at which expression is controlled.
- Describe how the lac operon is switched on and off by a repressor and an activator, and locate its control elements in the E. coli genome.
- Describe eukaryotic promoters, enhancers and transcription factors, and read the promoters of the human globin genes.
- Explain how chromatin, histone marks and DNA methylation make genes more or less accessible, and why CpG islands mark promoters.
- Describe RNA processing and alternative splicing, and how microRNAs and nonsense-mediated decay control mRNA levels.
- Use Python to find promoter elements and operators, measure CpG depletion and calculate expression changes from RNA-seq counts.
Before you start: Topics 1.1 to 1.4, especially transcription and translation, genome annotation and minus-strand coordinates, and the HBB variants from topic 1.4. Everything runs in your browser.
Why this matters for bioinformatics
Almost every cell in your body carries the same genome, yet a neuron, a liver cell and a developing red blood cell look and behave completely differently. The difference lies in which genes each cell uses, when, and how much: gene expression. A developing red blood cell makes so much haemoglobin that in its final stages most of its mRNA is globin mRNA, while a neuron makes none.
Much of bioinformatics measures expression and its control. RNA-seq counts the RNA made from every gene, ChIP-seq maps where proteins bind the genome, ATAC-seq finds open chromatin, and bisulfite sequencing reads DNA methylation. Regulation also matters for disease: about 93% of the variants that genome-wide association studies link to diseases and traits lie outside protein-coding sequence, and they cluster in regulatory DNA that controls how much of a protein is made.
Where gene expression is controlled
Making a protein takes many steps, and the cell can adjust almost every one of them:
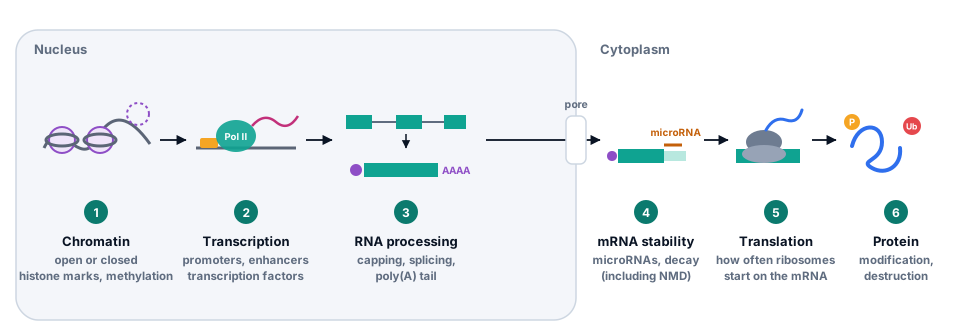
- Chromatin. DNA wrapped tightly in nucleosomes is hard to reach. Opening and closing chromatin decides which genes can be used at all.
- Transcription. Whether, and how often, RNA polymerase starts at a promoter. This is the main point of control for most genes, and the focus of this topic.
- RNA processing. Capping, splicing and polyadenylation. Alternative splicing makes different mRNAs from one gene.
- RNA export and stability. How long an mRNA lasts in the cytoplasm, which microRNAs and quality checks such as nonsense-mediated decay shorten.
- Translation. How often ribosomes start on an mRNA.
- Protein modification and destruction. Chemical tags switch proteins on and off, and the ubiquitin tag from topic 1.3 sends them for destruction.
Most genome-wide experiments measure RNA, because it is easy to sequence. RNA levels are a useful but imperfect stand-in for protein levels, since steps 4 to 6 come after the RNA is made. Genes that every cell needs, such as those for ribosomal proteins, are called housekeeping genes and are expressed fairly steadily; others are switched on only in certain cells or conditions.
Switching genes on and off: the lac operon
The first gene switch to be understood belongs to E. coli. The bacterium prefers glucose, and makes the enzymes for using lactose only when lactose is available. In 1961 François Jacob and Jacques Monod explained how, with the lac operon: three genes, lacZ, lacY and lacA, transcribed from one promoter into one mRNA.
- lacZ encodes β-galactosidase, which splits lactose into glucose and galactose and also converts some of it into allolactose.
- lacY encodes the lactose permease, which pumps lactose into the cell: the membrane protein whose helices you found with a hydropathy plot in topic 1.3.
- lacA encodes a transacetylase whose role is still not fully clear.
Two proteins control the operon:
- The Lac repressor, made by the neighbouring gene lacI, binds the operator O1, a 21-base-pair sequence that covers the start of transcription, and stops RNA polymerase from transcribing the genes. When lactose is present, allolactose binds the repressor, which changes shape and lets go of the DNA. A molecule that changes a protein’s activity by binding away from its active site is an allosteric effector. In the laboratory, IPTG does the same job and is not broken down.
- CAP (catabolite activator protein, also called CRP) is an activator. When glucose runs short, the cell makes more cyclic AMP (cAMP); CAP with cAMP bound attaches just upstream of the promoter and helps RNA polymerase start. The lac promoter is weak on its own, so it needs this help.
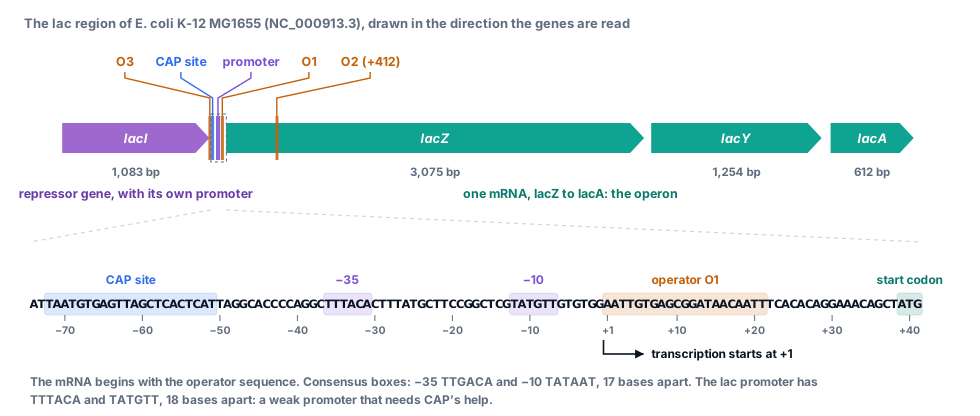
The repressor has two more binding sites, the weaker operators O2, inside lacZ, and O3, at the end of lacI. One repressor tetramer can grip two operators at once, looping the DNA between them. Removing O2 and O3 together weakens repression more than 50-fold, and O1 on its own represses only about 20-fold: the three operators work as a team.
Try this
- Find the two small DNA-binding domains, one on each half of the operator. Tyr17 and Arg22 of chain A (highlighted) reach into the major groove and touch the bases.
- Look at the centre of the operator. A short hinge helix from each subunit sits in the minor groove there, with Leu56 (highlighted on both chains) pressed against the central base pairs.
- Find ONPF (sticks) in the large core domain of each subunit, about 33 Å from the DNA. Inducers bind in this same pocket. The repressor is allosteric: binding there changes how the protein holds the DNA.
- Colour by Chain. The two subunits are related by a two-fold rotation, matching the operator, AATTGTGAGCGCTCACAATT, which reads the same on both strands. The natural O1 is almost, but not quite, symmetric.
Eukaryotic genes: promoters, enhancers and transcription factors
Eukaryotes have three nuclear RNA polymerases. RNA polymerase II makes every mRNA and many non-coding RNAs, while polymerases I and III make ribosomal RNAs, transfer RNAs and other small RNAs. RNA polymerase II cannot recognise a promoter by itself. A set of general transcription factors assembles first, and in many promoters the first to bind is the TATA-binding protein (TBP), which recognises a TATA box about 30 base pairs upstream of the transcription start. Many promoters, including most of those in CpG islands, have no TATA box, but TBP is still needed: all three RNA polymerases use it.
Try this
- TBP sits on the DNA like a saddle. Rotate the view until you can see that the DNA is sharply bent where it leaves the saddle on each side.
- Find the four highlighted phenylalanines, two at each end of the TATA box. Each pair wedges between two base pairs, which kinks the DNA.
- Look along the DNA. TBP binds the minor groove, which the bend has widened and flattened. Most transcription factors read the major groove instead.
- Colour by Secondary structure. The underside of the saddle that lies on the DNA is a large curved β-sheet.
Transcription factors and their motifs
Humans have about 1,600 transcription factors: proteins with a DNA-binding domain that recognises a short sequence, typically 6 to 12 base pairs, plus domains that recruit other proteins to activate or repress transcription. The sequences they prefer are called motifs, and motifs are known for about two-thirds of them. A 6-base motif turns up by chance about once every 4,000 bases on each strand, so a motif alone does not mean a factor binds: binding also depends on open chromatin, on neighbouring factors and on the exact sequence around the motif. You will meet this problem in the code lab, where a simple search finds a strong-looking match in lacA that the repressor is not known to use.
Promoters and enhancers
Upstream of the TATA box, the proximal promoter carries binding sites for factors that set how strongly the gene is used. In the human globin genes they are CCAAT boxes and CACCC boxes. Enhancers are more distant regulatory elements that can lie thousands, even hundreds of thousands, of bases from their gene, upstream or downstream, in either orientation. The DNA folds so that an enhancer and its proteins touch the promoter. Silencers reduce expression, and insulators limit which promoters an enhancer can reach.
The β-globin genes are controlled by a cluster of enhancers called the locus control region (LCR): five sites, 5′HS1 to 5′HS5, about 6 to 22 kb upstream of HBE1. They were first noticed because the DNA there is unusually easy to cut with the enzyme DNase I in red blood cell precursors, a sign of open chromatin, and in 1987 they were shown to give high-level, position-independent expression to the β-globin gene in mice.
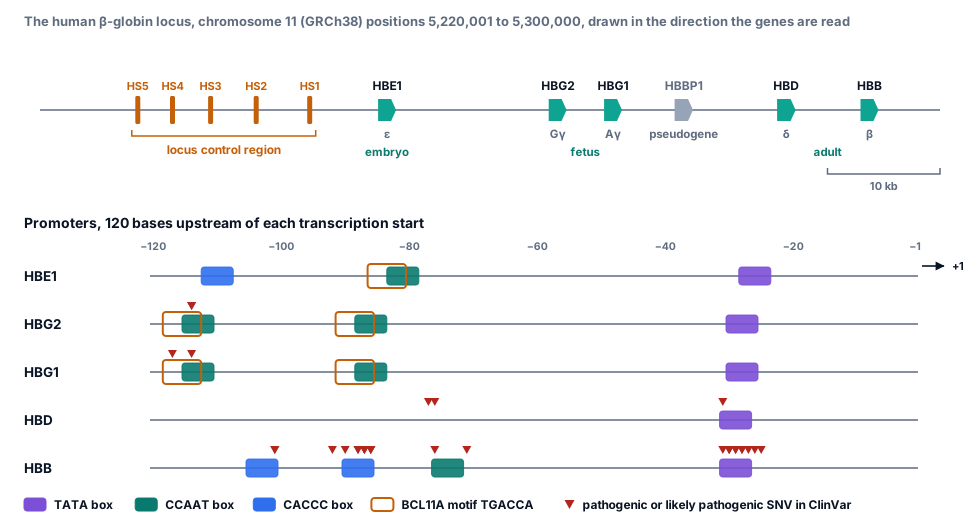
The variants that cause β-thalassaemia from the promoter fall on these elements. In this ClinVar release, pathogenic or likely pathogenic single-base changes affect 15 positions of the HBB promoter: every position from −31 to −25, in and next to the TATA box; five around the proximal CACCC box (−92 to −86); −101 in the distal CACCC box; and −76 and −71 at the CCAAT box. Each reduces how often transcription starts. The HBD promoter shows why δ-globin, which pairs with α-globin in the minor adult haemoglobin HbA2, is made in only small amounts: its CCAAT box reads CCAAC and it has no CACCC box, and in experiments restoring either one raises its expression.
Switching genes during development: the globin switch
The five β-like globin genes sit on chromosome 11 in the order in which they are used: ε (HBE1) in the early embryo, the two γ genes (HBG2 and HBG1) in the fetus, and δ (HBD) and β (HBB) after birth. Around birth, γ-globin is turned down and β-globin up, so that fetal haemoglobin (α2γ2) is replaced by adult haemoglobin (α2β2).
The γ genes are silenced mainly by two repressors. BCL11A binds a TGACCA motif in the distal CCAAT region, about 115 bases upstream of each γ gene, and ZBTB7A (also called LRF) binds about 200 bases upstream. In hereditary persistence of fetal haemoglobin (HPFH), a harmless condition, adults keep making fetal haemoglobin. Some forms are caused by single-base changes in exactly these binding sites; ClinVar lists, for example, −117G>A (Greek HPFH) and −114C>T in the BCL11A site, and −198T>C (British HPFH) near the ZBTB7A site. Breaking the repressor’s binding site keeps the fetal gene on.
People with sickle-cell disease or β-thalassaemia who also have high fetal haemoglobin have milder disease. That led to a new treatment. BCL11A is needed in many tissues, but in red blood cell precursors its expression depends on an erythroid-specific enhancer, found in 2013 through common variants linked to fetal haemoglobin levels. In exa-cel (Casgevy), a patient’s own blood stem cells are collected, CRISPR–Cas9 is used to cut that enhancer, and the cells are returned. In their red cells BCL11A falls, fetal haemoglobin rises, and in the first patients sickle-cell crises stopped and transfusions were no longer needed. Editing one enhancer in one cell type changes one gene in one lineage, which is the logic of gene regulation in a single treatment.
Chromatin and epigenetic marks
In topic 1.2 you saw DNA wrapped around histones in nucleosomes. Where nucleosomes are packed tightly, transcription factors cannot reach their sites; active promoters and enhancers are kept open, with nucleosomes moved aside. Cells mark the difference chemically, with tags on the histone tails that stick out of each nucleosome and with methyl groups on the DNA itself.
Histone modifications
Enzymes add and remove chemical groups such as methyl and acetyl groups on particular amino acids of the histone tails. Each mark is named by histone, residue and modification: H3K27ac is an acetyl group on lysine (K) 27 of histone H3. Proteins that recognise the marks open or close chromatin. A few marks are used constantly in genome analysis:
| Mark | Typically found at | Associated with |
|---|---|---|
| H3K4me3 | Promoters | Active or ready-to-go genes |
| H3K27ac | Enhancers and promoters | Active regulatory elements |
| H3K36me3 | Bodies of transcribed genes | Ongoing transcription |
| H3K27me3 | Broad regions around silenced developmental genes | Repression by Polycomb proteins |
| H3K9me3 | Repeats and heterochromatin | Stable silencing |
ChIP-seq with an antibody against one mark maps where it is across the genome, and combining several marks labels each region as an active promoter, enhancer, transcribed gene or silenced region. Marks are associated with activity rather than proving it, and cause and effect are still debated for some of them.
DNA methylation and CpG islands
In mammals most CpG sites carry a methyl group on the cytosine. After DNA is copied, the enzyme DNMT1 recognises CpGs that are methylated on the old strand only and methylates the new strand to match, so methylation patterns are copied along with the DNA. This is a form of epigenetic memory: information inherited through cell division without changing the sequence.
Because methylated cytosines tend to mutate to thymine (topic 1.4), CpG has been worn away from most of the genome. The exceptions are CpG islands: stretches of roughly a thousand bases that are rich in CpG and usually unmethylated, at the promoters of all housekeeping genes and many others. When a CpG-island promoter does become methylated, the gene is firmly silenced. This is how one X chromosome is shut down in female cells and how imprinted genes are expressed from only one parent’s copy, and it is one way tumour suppressor genes are switched off in cancer. Bisulfite sequencing, which converts unmethylated C to T so that methylation can be read from sequencing reads, measures methylation at single-base resolution.
After transcription: splicing, RNA stability and translation
A new transcript is processed while it is still being made: a 5′ cap is added, introns are spliced out and the 3′ end is cut and given a poly(A) tail. Topic 1.4 showed how mutations at each of these steps cause β-thalassaemia. Each step can also be regulated.
Alternative splicing
The spliceosome recognises the GT and AG at the ends of each intron, a branch-point A inside it and other signals, but the choice of splice sites is often flexible. Alternative splicing lets one gene make several mRNAs, and often several proteins (isoforms):
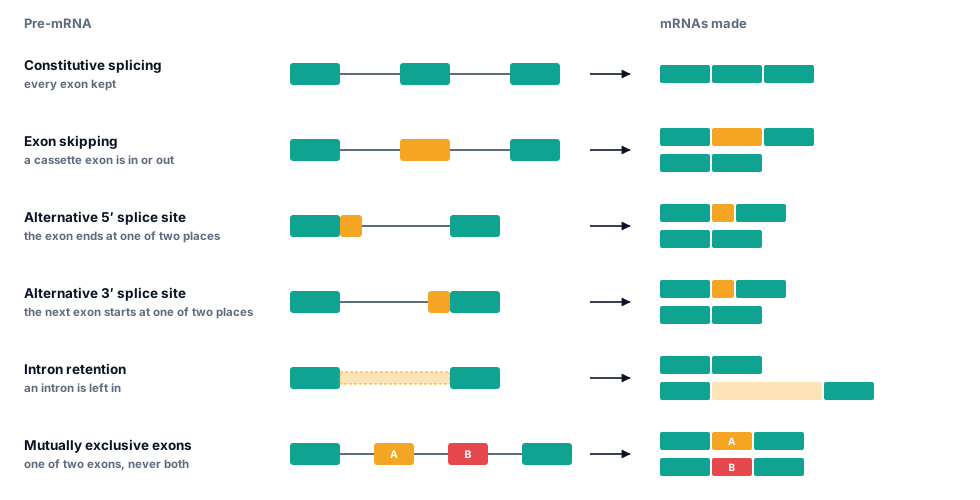
Sequencing RNA from many tissues showed that more than 90% of human multi-exon genes are alternatively spliced, many of them differently in different tissues. The choice is controlled by RNA-binding proteins that bind sequences in exons and introns and help or block nearby splice sites. One of them is Pasilla, the fruit-fly version of the mammalian NOVA proteins: knocking it down changed 405 splicing events in 323 genes, and the data from that experiment are the RNA-seq counts you will analyse in the code lab.
RNA stability and microRNAs
Once in the cytoplasm, an mRNA lasts from minutes to days. MicroRNAs are RNAs of about 22 nucleotides that guide a protein complex to mRNAs with a matching sequence, usually in the 3′ UTR, which reduces translation and speeds up decay. The first microRNA, lin-4, was found in the worm C. elegans in 1993, and its discoverers, Victor Ambros and Gary Ruvkun, received the 2024 Nobel Prize in Physiology or Medicine. Nonsense-mediated decay, from topic 1.4, is another quality check that removes faulty mRNAs, including many from mis-spliced transcripts.
Translation and protein life span
Cells also control how often ribosomes start on an mRNA, for example by changing initiation factors when nutrients are short, and how long proteins last. Ubiquitin, the small protein from topic 1.3, is attached to proteins that are to be destroyed, so a protein’s level depends on its rate of destruction as well as of synthesis.
Measuring gene expression
RNA sequencing (RNA-seq) copies RNA into DNA, sequences millions of short fragments and counts how many reads come from each gene. The result is a count matrix: one row per gene, one column per sample. Raw counts cannot be compared directly, because samples are sequenced to different depths: a sample with twice as many reads has about twice as many reads for every gene. Two simple normalisations fix this for most purposes:
- Counts per million (CPM) divide each count by the sample’s total reads, in millions. Use CPM to compare one gene across samples.
- Transcripts per million (TPM) also divide by gene length, because longer genes give more reads. Use it to compare different genes within a sample.
Changes are reported as a fold change, usually on a log2 scale so that doubling is +1 and halving −1. Whether a change is real, and not noise between replicates, needs statistics; you will meet the methods in topic 1.6 and use them on these same data in Level 4. The pasilla experiment had four untreated samples and three in which pasilla was knocked down by RNA interference.
Code lab: reading regulation from real data
Each box below is Python that runs in your browser: press Run (or Ctrl + Enter). The first run downloads Python, which takes a few seconds. Your edits are saved in this browser until you press Reset.
The first three boxes find the lac operon’s control elements in the E. coli genome. The next two measure CpG depletion in human and bacterial DNA, and the last two analyse the pasilla RNA-seq experiment. Boxes marked Exercise are checked automatically, with a hint and a worked solution.
Find the lac control region in the E. coli genome
Read the lac genes from the annotation, then take the 120 bases before lacZ’s start codon. lacZ is on the minus strand, so the region is reverse-complemented to read it along the operon, as the RNA polymerase does.
Data: NC_000913.3.fasta.gz NC_000913.3.gff3.gz
import gzip
def read_fasta(path):
    """Return (header, sequence) for a single-record FASTA file, gzipped or not."""
    opener = gzip.open if path.endswith(".gz") else open
    with opener(path, "rt") as handle:
        header = handle.readline().strip()
        return header, "".join(line.strip() for line in handle)

def reverse_complement(seq):
    return seq.translate(str.maketrans("ACGT", "TGCA"))[::-1]

_, genome = read_fasta("NC_000913.3.fasta.gz")
LACZ_START = 366305           # lacZ is on the minus strand, so its start codon is at the gene's end coordinate
upstream = reverse_complement(genome[LACZ_START:LACZ_START + 120])    # the 120 bases before ATG, read along the operon
tss = len(upstream) - 38      # the mRNA starts 38 bases before the start codon (Maizels 1973)

def relative(i):
    """Position relative to the transcription start (+1) of index i in upstream. There is no position 0."""
    return i - tss + 1 if i >= tss else i - tss

genes = {}
with gzip.open("NC_000913.3.gff3.gz", "rt") as handle:
    for line in handle:
        fields = line.rstrip("\n").split("\t")
        if len(fields) == 9 and fields[2] == "gene":
            name = dict(item.split("=", 1) for item in fields[8].split(";"))["Name"]
            if name in ("lacI", "lacZ", "lacY", "lacA"):
                genes[name] = (int(fields[3]), int(fields[4]), fields[6])
for name in ("lacI", "lacZ", "lacY", "lacA"):
    start, end, strand = genes[name]
    print(f"{name}: {start:,} to {end:,} ({strand} strand), {end - start + 1:,} bp")

print()
print("The 120 bases before lacZ's ATG, read along the operon:")
print(upstream)
for name, motif in [("CAP site", "TAATGTGAGTTAGCTCACTCAT"), ("-35 box", "TTTACA"), ("-10 box", "TATGTT"), ("operator O1", "AATTGTGAGCGGATAACAATT")]:
    i = upstream.find(motif)
    print(f"  {name:<12} {motif:<23} {relative(i):+d} to {relative(i + len(motif) - 1):+d}")
print("  The mRNA starts", upstream[tss:tss + 12] + "...")
What you should see
All four genes are on the minus strand, in the order lacI, lacZ (3,075 bp), lacY and lacA. The CAP site runs from −72 to −51 (centred at −61.5), the −35 box from −36 to −31, the −10 box from −12 to −7, and the operator O1 from +1 to +21: the repressor sits right on the start of the mRNA. The first 12 bases of the mRNA, AATTGTGAGCGG, are the start of O1 itself, exactly as Nancy Maizels found when she sequenced the lac mRNA in 1973.
Score the lac promoter
Bacterial promoters recognised by the main sigma factor, σ70, have a −35 box close to TTGACA and a −10 box close to TATAAT, ideally 17 bases apart. Write matches; the code then finds the best-scoring pair of boxes with a spacer of 15 to 19 bases, for the wild-type promoter and for lacUV5.
Data: NC_000913.3.fasta.gz
import gzip
def read_fasta(path):
    """Return (header, sequence) for a single-record FASTA file, gzipped or not."""
    opener = gzip.open if path.endswith(".gz") else open
    with opener(path, "rt") as handle:
        header = handle.readline().strip()
        return header, "".join(line.strip() for line in handle)

def reverse_complement(seq):
    return seq.translate(str.maketrans("ACGT", "TGCA"))[::-1]

_, genome = read_fasta("NC_000913.3.fasta.gz")
LACZ_START = 366305           # lacZ is on the minus strand, so its start codon is at the gene's end coordinate
upstream = reverse_complement(genome[LACZ_START:LACZ_START + 120])    # the 120 bases before ATG, read along the operon
tss = len(upstream) - 38      # the mRNA starts 38 bases before the start codon (Maizels 1973)

def relative(i):
    """Position relative to the transcription start (+1) of index i in upstream. There is no position 0."""
    return i - tss + 1 if i >= tss else i - tss

def matches(site, consensus):
    """Number of positions at which site and consensus have the same base."""
    return 0     # TODO

def best_promoter(seq):
    """Best -35 and -10 boxes with 15 to 19 bases between them: (score, -35 index, -10 index)."""
    best = (0, None, None)
    for i in range(len(seq) - 5):
        for spacer in range(15, 20):
            j = i + 6 + spacer
            if j + 6 <= len(seq):
                score = matches(seq[i:i + 6], "TTGACA") + matches(seq[j:j + 6], "TATAAT")
                if score > best[0]:
                    best = (score, i, j)
    return best

promoter = upstream[tss - 60:tss]          # positions -60 to -1
lacuv5 = promoter.replace("TATGTT", "TATAAT")
for name, seq in (("wild type", promoter), ("lacUV5", lacuv5)):
    score, i, j = best_promoter(seq)
    if i is None:
        print(name, ": no boxes found yet")
    else:
        print(f"{name}: -35 box {seq[i:i + 6]} at {i - 60}, -10 box {seq[j:j + 6]} at {j - 60},",
f"spacer {j - i - 6} bases, score {score}/12")Find all three lac operators
Scan 700 bases around the promoter, on both strands, for 21-base stretches that match O1 at 13 or more of its 21 positions. Write scan; the code converts the hits on the reverse strand back to plus-strand coordinates.
Data: NC_000913.3.fasta.gz
import gzip
def read_fasta(path):
    """Return (header, sequence) for a single-record FASTA file, gzipped or not."""
    opener = gzip.open if path.endswith(".gz") else open
    with opener(path, "rt") as handle:
        header = handle.readline().strip()
        return header, "".join(line.strip() for line in handle)

def reverse_complement(seq):
    return seq.translate(str.maketrans("ACGT", "TGCA"))[::-1]

_, genome = read_fasta("NC_000913.3.fasta.gz")
O1 = "AATTGTGAGCGGATAACAATT"          # the main lac operator, read along the operon
TSS = 366343                           # chromosome position of the lac mRNA's first base (+1)
lo, hi = 365800, 366500                # 700 bases around the promoter, 1-based and inclusive
window = genome[lo - 1:hi]

def scan(seq, motif, threshold):
    """(index, score) for every stretch of seq, as long as motif, that matches it at threshold positions or more."""
    hits = []
    # TODO: for each start index i, count the positions where seq[i:i + len(motif)] matches motif
    return hits

found = [(lo + i, "+", score) for i, score in scan(window, O1, 13)]
# On the reversed strand, index i covers plus-strand positions hi - i - 20 to hi - i
found += [(hi - i - 20, "-", score) for i, score in scan(reverse_complement(window), O1, 13)]
for start, strand, score in sorted(found):
    centre = start + 10
    position = TSS - centre + 1 if centre <= TSS else -(centre - TSS)     # the operon is read on the minus strand
print(f"{start:,} to {start + 20:,} ({strand} strand): {score}/21 matches, centred at {position:+d}")CpG depletion: human versus bacterial DNA
Compare how often the dinucleotide CG occurs with how often it would occur if bases followed each other at random, given the amounts of C and G. GC, the same two bases in the opposite order, is a control.
Data: NC_000913.3.fasta.gz NC_000011.10_5220001-5300000.fasta
import gzip
def read_fasta(path):
    """Return (header, sequence) for a single-record FASTA file, gzipped or not."""
    opener = gzip.open if path.endswith(".gz") else open
    with opener(path, "rt") as handle:
        header = handle.readline().strip()
        return header, "".join(line.strip() for line in handle)

def observed_expected(seq, pair):
    """Observed count of a two-base pair, divided by the count expected from its bases' frequencies."""
    expected = seq.count(pair[0]) * seq.count(pair[1]) / len(seq)
    return seq.count(pair) / expected, seq.count(pair), expected

for name, path in (("E. coli genome", "NC_000913.3.fasta.gz"), ("Human beta-globin region", "NC_000011.10_5220001-5300000.fasta")):
    _, seq = read_fasta(path)
    print(f"{name}: {len(seq):,} bases, {(seq.count('G') + seq.count('C')) / len(seq):.1%} G + C")
    for pair in ("CG", "GC"):
        ratio, observed, expected = observed_expected(seq, pair)
        print(f"  {pair}: {observed:>7,} found, {expected:>9,.0f} expected, ratio {ratio:.2f}")
What you should see
In E. coli, which does not methylate CpG, CG occurs slightly more often than chance predicts (ratio 1.16). In the human region it occurs at 0.18 of the expected rate, 573 times instead of about 3,110, while GC is right at expectation (1.01). The depletion is specific to CG, the dinucleotide that is methylated and mutates. (Counting with str.count is safe here because neither CG nor GC can overlap itself.)
Which dinucleotides are rare in human DNA?
Work out the observed/expected ratio of all 16 dinucleotides in the human β-globin region, counting overlapping pairs. If CpGs mutate to TpG (and CpA on the other strand), what should happen to TG and CA?
Data: NC_000011.10_5220001-5300000.fasta
from collections import Counter
def read_fasta(path):
    """Return (header, sequence) for a single-record FASTA file."""
    with open(path) as handle:
        header = handle.readline().strip()
        return header, "".join(line.strip() for line in handle)

_, region = read_fasta("NC_000011.10_5220001-5300000.fasta")

def dinucleotide_ratios(seq):
    """Observed / expected count for each of the 16 dinucleotides, counting overlapping pairs."""
    singles = Counter(seq)
    pairs = Counter()          # TODO: count seq[i:i + 2] for every i from 0 to len(seq) - 2
    n_pairs = len(seq) - 1
    ratios = {}
    for a in "ACGT":
        for b in "ACGT":
            expected = n_pairs * (singles[a] / len(seq)) * (singles[b] / len(seq))
            ratios[a + b] = pairs[a + b] / expected
    return ratios

ratios = dinucleotide_ratios(region)
for pair, ratio in sorted(ratios.items(), key=lambda item: item[1]):
print(f"{pair} {ratio:.2f} {'#' * round(ratio * 20)}")Counts per million: the pasilla knockdown
Load the pasilla count matrix, work out each sample’s library size, and compare the raw counts and counts per million of the pasilla gene itself.
Data: pasilla_gene_counts.tsv
with open("pasilla_gene_counts.tsv") as handle:
    samples = handle.readline().rstrip("\n").split("\t")[1:]
    counts = {}                                    # gene ID -> counts in each sample
    for line in handle:
        fields = line.rstrip("\n").split("\t")
        counts[fields[0]] = [int(x) for x in fields[1:]]

library = [sum(gene[i] for gene in counts.values()) for i in range(len(samples))]
ps = counts["FBgn0261552"]                         # the pasilla gene
print(f"{len(counts):,} genes x {len(samples)} samples")
print(f"{'sample':<12}{'library size':>14}{'pasilla reads':>15}{'pasilla CPM':>13}")
for name, size, n in zip(samples, library, ps):
    print(f"{name:<12}{size:>14,}{n:>15,}{n / size * 1e6:>13.1f}")
What you should see
The libraries range from 8.4 to 21.9 million counted reads. Raw counts are misleading: untreated2 has 16,750 pasilla reads against 4,760 in untreated4, mostly because it was sequenced more than twice as deeply. In counts per million, the four untreated samples lie between 484 and 764, and the three knockdown samples between 135 and 227. RNA interference cut pasilla mRNA to roughly a quarter.
Fold changes from RNA-seq counts
Write cpm, mean and log2_fold_change (knockdown versus untreated, from mean CPM). Then compare pasilla with RpL32, a ribosomal protein gene often used as a stable reference, and list the genes that fall most.
Data: pasilla_gene_counts.tsv
import math

with open("pasilla_gene_counts.tsv") as handle:
    samples = handle.readline().rstrip("\n").split("\t")[1:]
    counts = {}                                    # gene ID -> counts in each sample
    for line in handle:
        fields = line.rstrip("\n").split("\t")
        counts[fields[0]] = [int(x) for x in fields[1:]]
library = [sum(gene[i] for gene in counts.values()) for i in range(len(samples))]
untreated = [i for i, name in enumerate(samples) if name.startswith("untreated")]
treated = [i for i, name in enumerate(samples) if name.startswith("treated")]
PS, RPL32 = "FBgn0261552", "FBgn0002626"           # pasilla, and the ribosomal protein gene RpL32

def cpm(gene):
    """Counts per million for one gene, in every sample."""
    return [0.0] * len(samples)       # TODO: each count divided by its library size, times one million

def mean(values, columns):
    """Mean of values at the given column indices."""
    return 0.0                        # TODO

def log2_fold_change(gene):
    """log2 of (mean CPM in treated samples / mean CPM in untreated samples)."""
    return 0.0                        # TODO: use math.log2

print(f"pasilla: log2 fold change {log2_fold_change(PS):.2f}")
print(f"RpL32:   log2 fold change {log2_fold_change(RPL32):.2f}")

expressed = [gene for gene in counts if mean(cpm(gene), untreated) >= 10 and mean(cpm(gene), treated) > 0]
ranked = sorted(expressed, key=log2_fold_change)
print()
print(len(expressed), "genes with a mean of at least 10 CPM in untreated cells. The five that fall most:")
for gene in ranked[:5]:
    print(f"  {gene}  {log2_fold_change(gene):.2f}")
print("pasilla itself ranks", ranked.index(PS) + 1)
Check your understanding
Ten questions. Score 70% or more to complete this part of the topic. You can retake it as often as you like.
Mini project: read the promoters of the globin genes
The five β-like globin genes are switched on at different stages of development. Their promoters should show why. Search each promoter for the elements you have met in this topic.
- Find each gene’s transcription start site from its RefSeq transcript in the annotation and extract the 120 bases upstream (given).
- Write
find_motifs, which reports where each motif starts, relative to +1, within its window: the TATA box between −40 and −20, the others between −120 and −41. - Compare the five genes.
The globin promoters
Data: NC_000011.10_5220001-5300000.fasta NC_000011.10_5220001-5300000.gff3
def read_fasta(path):
    """Return (header, sequence) for a single-record FASTA file."""
    with open(path) as handle:
        header = handle.readline().strip()
        return header, "".join(line.strip() for line in handle)

def reverse_complement(seq):
    return seq.translate(str.maketrans("ACGT", "TGCA"))[::-1]

_, region = read_fasta("NC_000011.10_5220001-5300000.fasta")
OFFSET = 5220001

# 1. The transcription start site (+1) of each globin gene, from its RefSeq transcript in the annotation.
#    All five genes are on the minus strand, so each transcript's 5′ end is its end coordinate.
transcripts = {"NM_005330.4": "HBE1", "NM_000184.3": "HBG2", "NM_000559.3": "HBG1", "NM_000519.4": "HBD", "NM_000518.5": "HBB"}
tss = {}
with open("NC_000011.10_5220001-5300000.gff3") as handle:
    for line in handle:
        fields = line.rstrip("\n").split("\t")
        if len(fields) == 9 and fields[2] == "mRNA":
            tid = dict(item.split("=", 1) for item in fields[8].split(";"))["transcript_id"]
            if tid in transcripts:
                tss[transcripts[tid]] = int(fields[4])

def promoter(gene, length=120):
    """Bases -length to -1 of a minus-strand gene, read 5′ to 3′ along the gene."""
    start = tss[gene] + 1 - OFFSET
    return reverse_complement(region[start:start + length])

# 2. Motifs to look for, each with the window (relative to +1) where it works
MOTIFS = {"TATA": ("ATAAA", -40, -20), "CCAAT": ("CCAAT", -120, -41),
          "CACCC": ("CACCC", -120, -41), "BCL11A": ("TGACCA", -120, -41)}

def find_motifs(seq):
    """For each motif, the positions (relative to +1) where it starts within its window."""
    found = {}
    # TODO: for each name, (motif, lo, hi) in MOTIFS.items(), check every index i of seq.
    #       The base at index i is at position i - len(seq), so the last base, index len(seq) - 1, is -1.
    #       Keep the position when lo <= position <= hi and seq[i:i + len(motif)] == motif.
    return found

results = {gene: find_motifs(promoter(gene)) for gene in ("HBE1", "HBG2", "HBG1", "HBD", "HBB")}
for gene, found in results.items():
    print(f"{gene:<5}", "   ".join(f"{name} {found[name] or '-'}" for name in MOTIFS))
Go further
- Extend the search to 250 bases and look for GATA motifs (WGATAR), bound by the red-cell transcription factor GATA1. Are they spread evenly between the genes?
- Use the ClinVar file from topic 1.4 to list every variant in the HBG1 and HBG2 promoters and mark which ones fall inside the motifs you found.
- Read the DNaseI_hypersensitive_site lines of the GFF3 file and print each site’s distance from the HBB transcription start.
- The pasilla counts table holds 14,599 genes. How many have zero counts in every sample, and why might a gene not be expressed in these cells at all?
Summary and further reading
Key takeaways
- Cells with the same genome differ in which genes they express. Expression is controlled at every step, from chromatin and transcription to RNA processing, RNA stability, translation and protein destruction.
- The lac operon is switched off by a repressor bound to the operator and switched on by lactose, which releases it, with CAP–cAMP boosting a weak promoter when glucose is scarce.
- Eukaryotic genes are controlled by core promoters such as the TATA box, proximal elements such as CCAAT and CACCC boxes, and distant enhancers, read by about 1,600 human transcription factors.
- Developmental switches such as the γ-to-β globin switch depend on repressors binding specific motifs; breaking a site (HPFH) or an enhancer (exa-cel therapy) changes which gene is used.
- Histone marks and DNA methylation make chromatin open or closed. CpG islands mark promoters and stay unmethylated, while CpG is depleted from the rest of the genome.
- Alternative splicing, microRNAs and nonsense-mediated decay act after transcription. RNA-seq counts need normalisation, such as counts per million, before samples are compared.
Key terms
Data used on this page
- Escherichia coli K-12 MG1655 genome and annotation
- Human β-globin locus on chromosome 11 (GRCh38)
- pasilla RNA-seq gene counts
- Human β-globin variants: ClinVar and 1000 Genomes
- Protein–DNA complexes: p53, the Lac repressor and TBP
References and further reading
- Jacob F, Monod J. Genetic regulatory mechanisms in the synthesis of proteins. Journal of Molecular Biology 3, 318–356 (1961). doi:10.1016/S0022-2836(61)80072-7
- Maizels NM. The nucleotide sequence of the lactose messenger ribonucleic acid transcribed from the UV5 promoter mutant of Escherichia coli. PNAS 70, 3585–3589 (1973). doi:10.1073/pnas.70.12.3585
- Oehler S, Eismann ER, Krämer H, Müller-Hill B. The three operators of the lac operon cooperate in repression. EMBO Journal 9, 973–979 (1990). doi:10.1002/j.1460-2075.1990.tb08199.x
- Lewis M, et al. Crystal structure of the lactose operon repressor and its complexes with DNA and inducer. Science 271, 1247–1254 (1996). doi:10.1126/science.271.5253.1247
- Bell CE, Lewis M. A closer view of the conformation of the Lac repressor bound to operator. Nature Structural Biology 7, 209–214 (2000). doi:10.1038/73317
- Inada T, Kimata K, Aiba H. Mechanism responsible for glucose–lactose diauxie in Escherichia coli: challenge to the cAMP model. Genes to Cells 1, 293–301 (1996). doi:10.1046/j.1365-2443.1996.24025.x
- Silverstone AE, Arditti RR, Magasanik B. Catabolite-insensitive revertants of lac promoter mutants. PNAS 66, 773–779 (1970). doi:10.1073/pnas.66.3.773
- Studier FW, Moffatt BA. Use of bacteriophage T7 RNA polymerase to direct selective high-level expression of cloned genes. Journal of Molecular Biology 189, 113–130 (1986). doi:10.1016/0022-2836(86)90385-2
- Kim Y, Geiger JH, Hahn S, Sigler PB. Crystal structure of a yeast TBP/TATA-box complex. Nature 365, 512–520 (1993). doi:10.1038/365512a0
- Nikolov DB, et al. Crystal structure of a human TATA box-binding protein/TATA element complex. PNAS 93, 4862–4867 (1996). doi:10.1073/pnas.93.10.4862
- Lambert SA, et al. The human transcription factors. Cell 172, 650–665 (2018). doi:10.1016/j.cell.2018.01.029
- Myers RM, Tilly K, Maniatis T. Fine structure genetic analysis of a β-globin promoter. Science 232, 613–618 (1986). doi:10.1126/science.3457470
- Grosveld F, et al. Position-independent, high-level expression of the human β-globin gene in transgenic mice. Cell 51, 975–985 (1987). doi:10.1016/0092-8674(87)90584-8
- Tang DC, et al. Restoration of the CCAAT box or insertion of the CACCC motif activate δ-globin gene expression. Blood 90, 421–427 (1997). doi:10.1182/blood.V90.1.421
- Liu N, et al. Direct promoter repression by BCL11A controls the fetal to adult hemoglobin switch. Cell 173, 430–442 (2018). doi:10.1016/j.cell.2018.03.016
- Martyn GE, et al. Natural regulatory mutations elevate the fetal globin gene via disruption of BCL11A or ZBTB7A binding. Nature Genetics 50, 498–503 (2018). doi:10.1038/s41588-018-0085-0
- Bauer DE, et al. An erythroid enhancer of BCL11A subject to genetic variation determines fetal hemoglobin level. Science 342, 253–257 (2013). doi:10.1126/science.1242088
- Frangoul H, et al. CRISPR-Cas9 gene editing for sickle cell disease and β-thalassemia. New England Journal of Medicine 384, 252–260 (2021). doi:10.1056/NEJMoa2031054
- Orkin SH. The fetal-to-adult hemoglobin switch: mechanism and therapy. New England Journal of Medicine 392, 2135–2149 (2025). doi:10.1056/NEJMra2405260
- Kouzarides T. Chromatin modifications and their function. Cell 128, 693–705 (2007). doi:10.1016/j.cell.2007.02.005
- Bird A. DNA methylation patterns and epigenetic memory. Genes & Development 16, 6–21 (2002). doi:10.1101/gad.947102
- Gardiner-Garden M, Frommer M. CpG islands in vertebrate genomes. Journal of Molecular Biology 196, 261–282 (1987). doi:10.1016/0022-2836(87)90689-9
- Maurano MT, et al. Systematic localization of common disease-associated variation in regulatory DNA. Science 337, 1190–1195 (2012). doi:10.1126/science.1222794
- ENCODE Project Consortium, et al. Expanded encyclopaedias of DNA elements in the human and mouse genomes. Nature 583, 699–710 (2020). doi:10.1038/s41586-020-2493-4
- Wang ET, et al. Alternative isoform regulation in human tissue transcriptomes. Nature 456, 470–476 (2008). doi:10.1038/nature07509
- Pan Q, et al. Deep surveying of alternative splicing complexity in the human transcriptome by high-throughput sequencing. Nature Genetics 40, 1413–1415 (2008). doi:10.1038/ng.259
- Brooks AN, et al. Conservation of an RNA regulatory map between Drosophila and mammals. Genome Research 21, 193–202 (2011). doi:10.1101/gr.108662.110
- Lee RC, Feinbaum RL, Ambros V. The C. elegans heterochronic gene lin-4 encodes small RNAs with antisense complementarity to lin-14. Cell 75, 843–854 (1993). doi:10.1016/0092-8674(93)90529-Y
- FDA news release (8 December 2023): FDA approves first gene therapies to treat patients with sickle cell disease. www.fda.gov
Finished the topic?
Pass the check and the exercises, or mark the topic complete yourself. Progress is saved in this browser.